Each month, The
Canadian Real Estate Association compiles the statistics of
existing homes and properties sold through the Multiple Listing
Service®. This provides an overview of the existing housing
market in Canada, and tracks market trends for prices and
properties sold.
The detailed reports are available to
REALTORS® to help in market analysis. This map will show
what the latest statistics for major markets across Canada,
based on the MLS® reports provided by local real estate
Boards. By dragging your mouse across a specific city, the
latest average price
will appear. The latest news release dealing with our MLS®
statistics is available in the Media Center web page.
 |
 |
 |
|
Ontario |
$275,466 Jan 09
$302,191 Jan 08 |
|
Toronto |
$353,632 Jan 09
$374,449 Jan 08 |
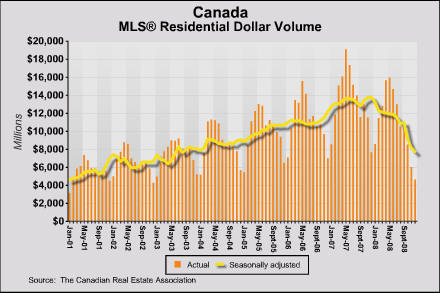
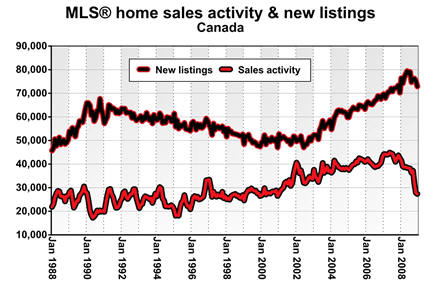
Units Sales
The number of properties sold via the MLS® systems
of real estate boards in Canada edged down further in
December 2008 to reach the lowest level for the month since
December 2000, according to statistics released by The
Canadian Real Estate Association (CREA).
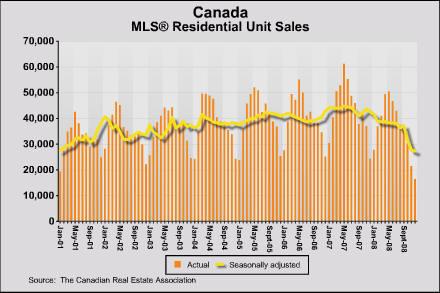
Seasonally adjusted residential MLS® sales
activity numbered 27,357 units in December 2008, a decline of
1.8 per cent compared to the previous month.
However, seasonally adjusted activity was up
in more than half of Canadian housing markets. Activity declines
in Montreal, Calgary and Edmonton more than offset a rebound in
the number of transactions in Vancouver, resulting in a small
monthly decline in national sales activity.
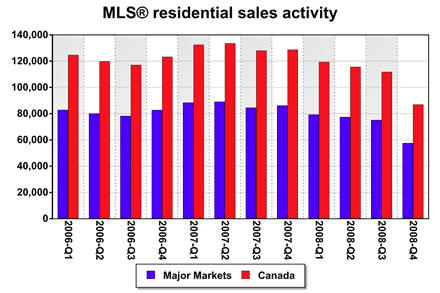
The small month-over-month decline in
national MLS® seasonally adjusted sales activity in December
followed double digit declines in September (-14.9 per cent) and
October (-12.1 per cent). Activity plummeted 22.2 per cent in
the fourth quarter of 2008 to 86,879 units, with seasonally
adjusted quarterly declines in activity in all provinces. The
sharp drop in fourth quarter activity accounted for over half of
the decline in transactions since the peak in 2007.
|